
You finish a job, send the invoice, and the client pays. Revenue’s up, work’s steady, everyone’s happy. But when you sit down at the end of the quarter, you realise your bank balance doesn’t match your expectations. Sound familiar?
Trade businesses face unique bookkeeping challenges that don’t apply to most other industries. Progress claims, retention holdbacks, work-in-progress tracking, and job-by-job cost allocation all require a different approach to financial management. Get these wrong, and you might be running profitable jobs on paper while running out of cash in practice.
This guide covers how bookkeeping for tradies works in Australia, including ATO expense benchmarks for trades, job costing fundamentals, and the financial metrics every tradie should be tracking. Whether you’re an electrician, plumber, carpenter, or builder, understanding these numbers is essential for running a sustainable business.
What Makes Tradie Bookkeeping Different
Most bookkeeping assumes a simple cycle: buy stock, sell product, collect payment. Trade businesses don’t work that way. Projects can span months. You might be paid progressively based on milestones. A percentage of each payment may be held back until defects liability periods expire. And you can’t easily compare one job to another without tracking costs at the project level.
These differences mean standard bookkeeping practices often miss critical information. Your P&L might show a profit, but if most of that profit is tied up in unbilled work or retention, you won’t have cash to pay suppliers or wages.
Three things that make tradie bookkeeping unique:
Job costing is essential. Unlike retail or service businesses where transactions are largely interchangeable, every construction project has different scope, materials, and labour requirements. Without job-level cost tracking, you won’t know which projects are profitable — and you’ll keep quoting the unprofitable ones at the same margins.
Cash flow timing is unpredictable. Progress claims, retention holdbacks, and slow-paying clients mean your revenue recognition rarely matches your cash collection. A project showing $50,000 profit on paper might have $30,000 tied up in retention that won’t be released for 12 months.
Compliance requirements are higher. Security of payment legislation, insurance obligations, and licensing requirements all create administrative overhead that simpler businesses don’t face. Getting these wrong can result in disputes, payment delays, or regulatory problems.
ATO Small Business Benchmarks for Trades
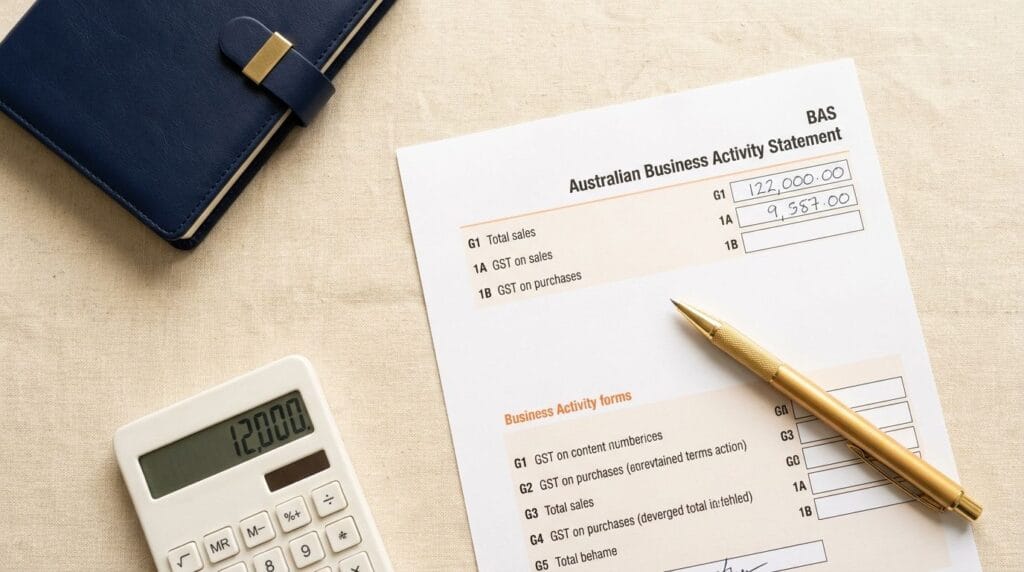
The ATO publishes expense-to-turnover benchmarks based on tax return data. These figures show what similar businesses typically spend relative to their revenue. If your ratios fall significantly outside these ranges, the ATO may flag your return for review — or it may simply indicate room to improve efficiency.
The key benchmark is total expenses to turnover. This captures all deductible business expenses (materials, labour, vehicles, rent, insurance, depreciation, and everything else) as a percentage of revenue. The ATO also breaks out major expense categories like cost of sales, labour, and motor vehicle expenses as separate benchmarks.
A few things to note when reading these tables:
- Total expenses is the headline metric — it includes everything
- Cost of sales covers materials, consumables, and stock (but excludes labour)
- Labour includes wages and subcontractor payments (excluding GST)
- Motor vehicle covers all vehicle-related expenses
- These sub-ratios don’t add up to total expenses — other costs like rent, insurance, and admin make up the remainder
- The highest turnover bracket (e.g., ‘$500,000+’) includes all businesses above that threshold, including those turning over $1M–$5M and beyond

Electrical Services (2023–24)
| Metric | $50K–$200K | $200K–$500K | $500K+ |
|---|---|---|---|
| Total Expenses / Turnover | 51%–68% | 59%–75% | 75%–86% |
| Average total expenses | 59% | 67% | 81% |
| — Cost of Sales | 22%–34% | 26%–36% | 30%–41% |
| — Labour | 21%–35% | 17%–30% | 23%–34% |
| — Motor Vehicle | 6%–10% | 4%–7% | 3%–4% |
Plumbing Services (2023–24)
| Metric | $50K–$150K | $150K–$600K | $600K+ |
|---|---|---|---|
| Total Expenses / Turnover | 50%–66% | 59%–74% | 75%–86% |
| Average total expenses | 58% | 66% | 80% |
| — Cost of Sales | 20%–33% | 26%–35% | 29%–38% |
| — Labour | 21%–34% | 16%–27% | 23%–33% |
| — Motor Vehicle | 7%–11% | 5%–7% | 3%–5% |
Carpentry Services (2023–24)
| Metric | $50K–$110K | $110K–$400K | $400K+ |
|---|---|---|---|
| Total Expenses / Turnover | 32%–50% | 46%–66% | 76%–87% |
| Average total expenses | 41% | 56% | 81% |
| — Labour | 24%–39% | 21%–35% | 27%–43% |
| — Motor Vehicle | 8%–12% | 5%–8% | 2%–4% |
Note: The ATO does not publish a cost of sales benchmark for carpentry services.
What These Benchmarks Tell You
Lower total expense ratios generally mean higher profit margins — but context matters. A sole trader with no employees will naturally show lower labour costs than a business with a team. A plumber who does mostly service calls will have different cost of sales ratios than one running large bathroom renovation projects.
The real value is in tracking your own ratios over time and investigating significant changes. If your total expenses jumped from 65% to 78% year-on-year, that’s worth understanding — whether it’s a one-off equipment purchase, a pricing problem, or scope creep on jobs.
These benchmarks are also a useful sanity check when quoting. If you’re consistently running above the benchmark for your turnover bracket, your pricing may not be keeping pace with your costs.
Job Costing: The Foundation of Trade Business Profitability
Job costing means allocating every expense to a specific project. Materials, labour hours, subcontractor invoices, equipment hire, and even vehicle costs should be tracked against individual jobs. Without this, you’re flying blind.
The goal is simple: know exactly how much each job cost you, so you can compare it to what you quoted and what you invoiced. Over time, this data tells you which job types are most profitable, which estimates need adjustment, and where you’re losing money.
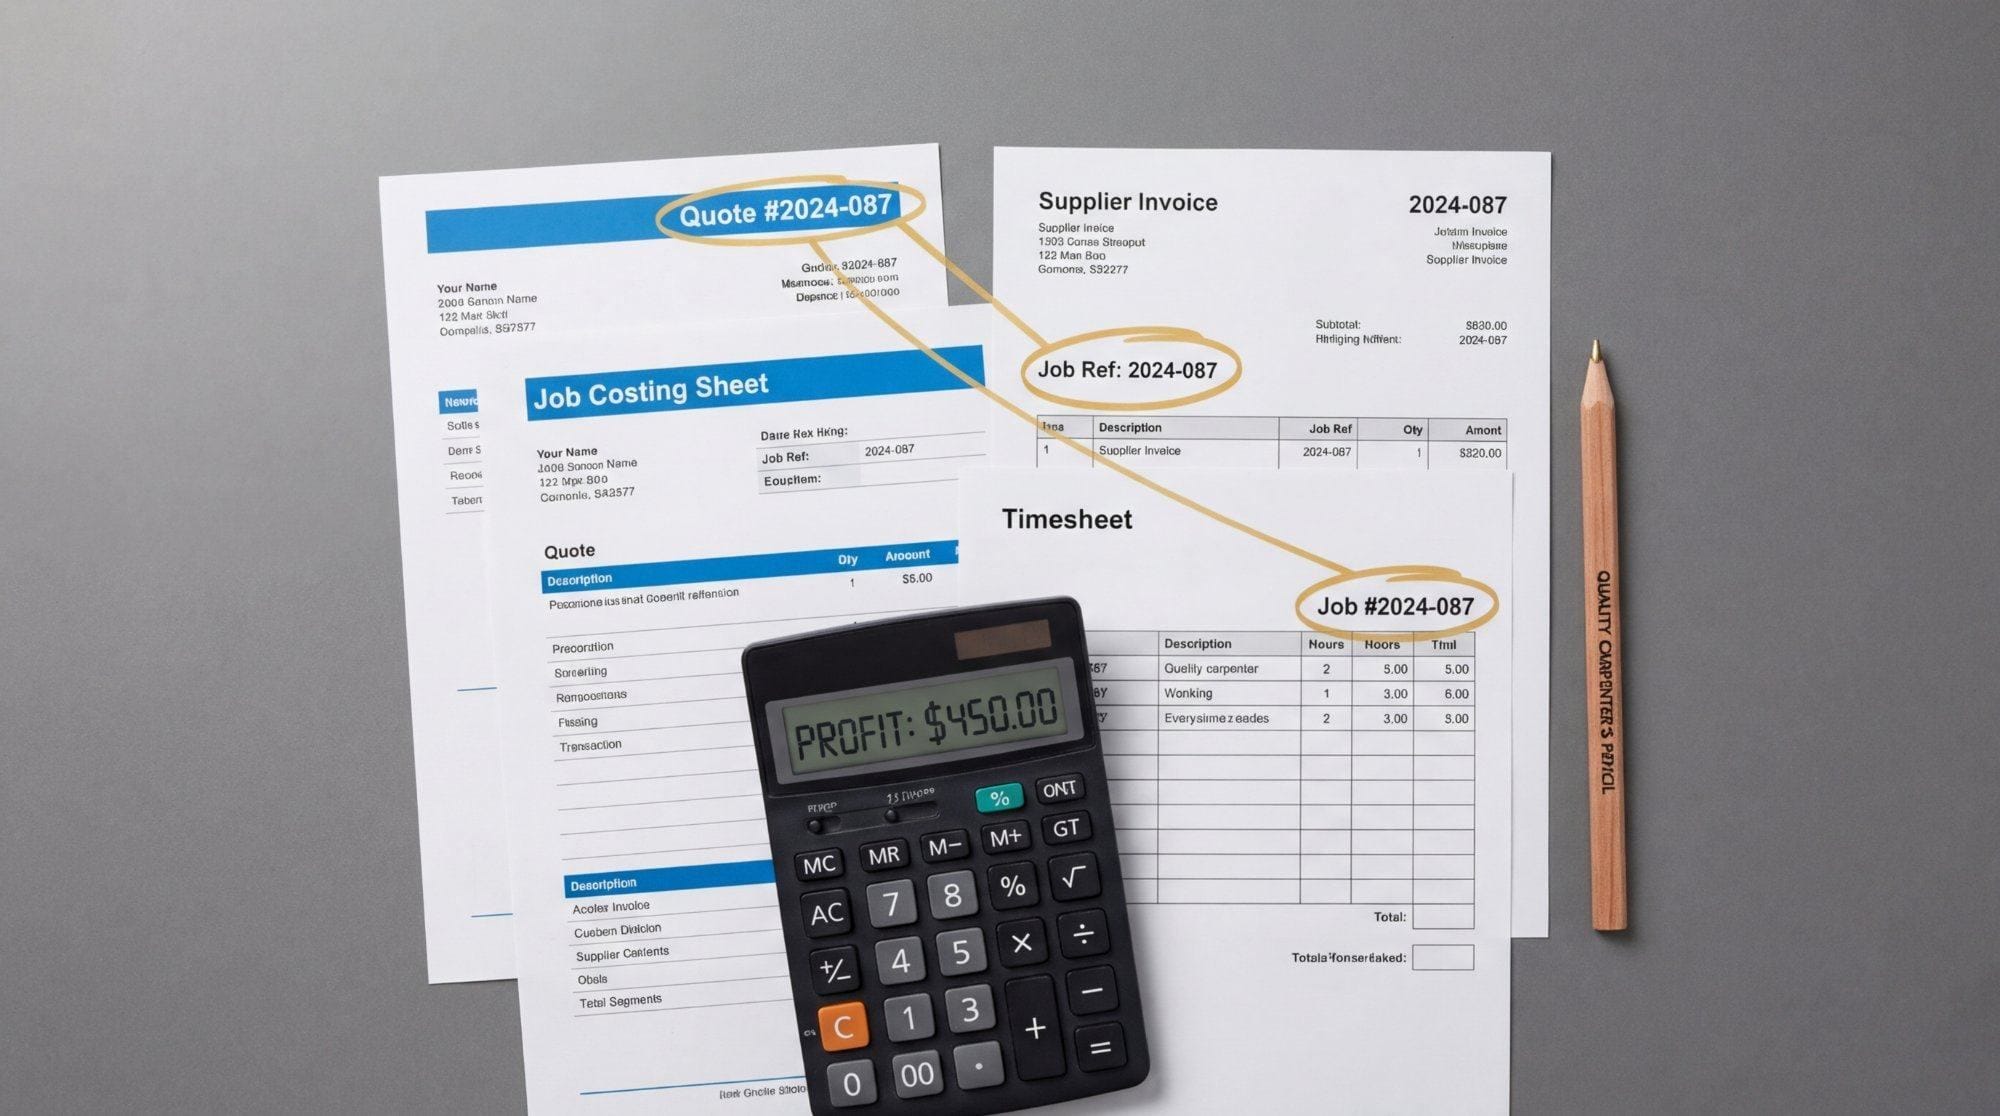
Setting Up Job Costing
Every job needs a unique identifier — a job number or code that appears on purchase orders, timesheets, supplier invoices, and your accounting software. When your electrician buys cable from the supplier, the purchase order should reference the job number. When your apprentice logs their hours, they should be coded to specific jobs.
Most accounting software supports job or project tracking. Xero has project tracking, MYOB has job tracking, and dedicated trade software like Tradify, Fergus, or ServiceM8 is designed around job costing. The key is consistency: every transaction needs to be coded correctly, or your data becomes unreliable.
Analysing Job Performance
At the end of each job, run a variance report comparing actual costs to your quote. Where did you estimate correctly? Where did you lose money? Common culprits include underestimating labour hours, scope creep that wasn’t invoiced, or material price increases you didn’t pass on.
Track these patterns over time. If you’re consistently underquoting labour on renovation jobs, adjust your estimating. If materials are always coming in higher than quoted, build in a buffer or requote mid-project when you see prices rising.
Managing Cash Flow in Trade Businesses
Cash flow is where many tradies struggle — even profitable ones. The timing mismatch between when you incur costs and when you collect payment can create serious pressure.
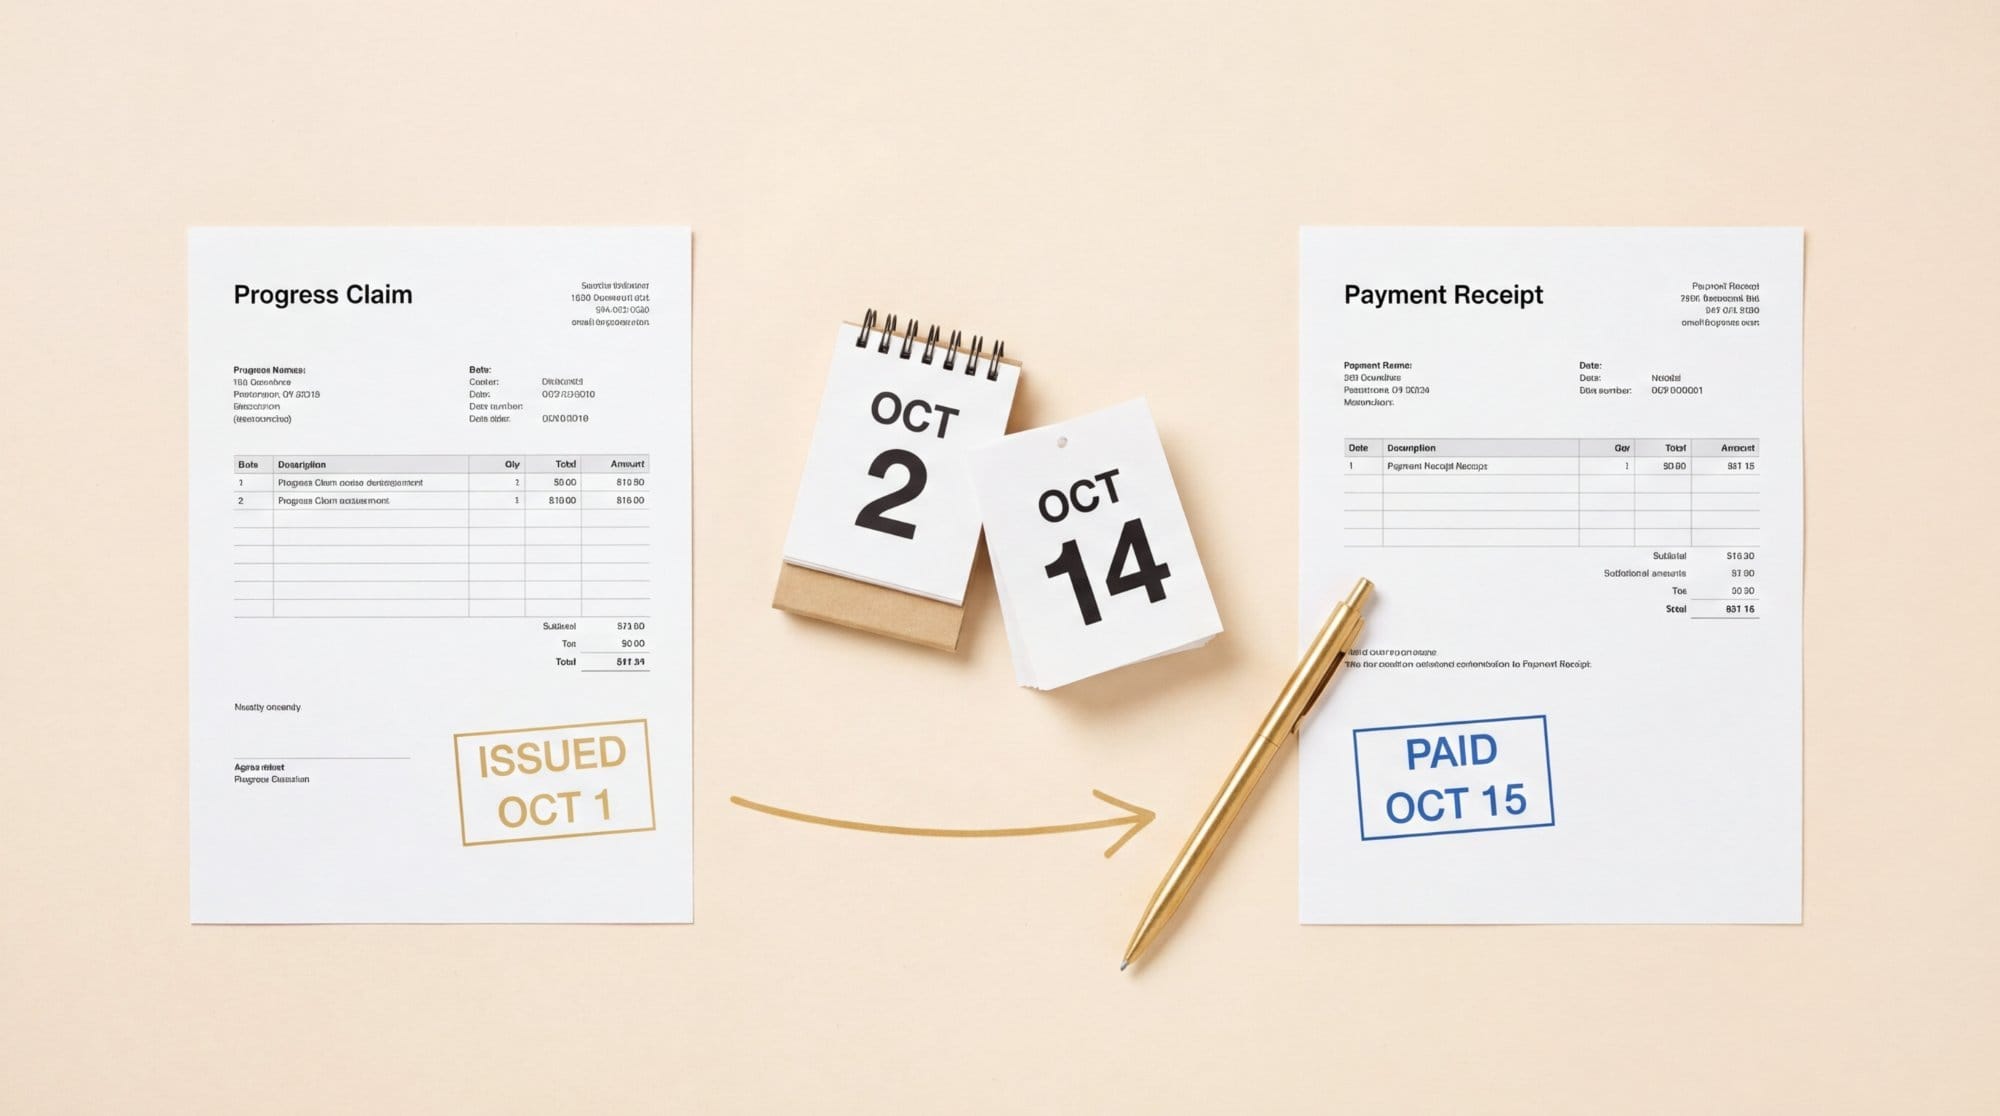
Progress Claims
For larger projects, progress claims let you bill as you go rather than waiting until completion. This improves cash flow significantly, but requires careful tracking. Each claim should reference completed milestones, and you need to track what’s been claimed versus what’s been paid.
Bill as frequently as your contract allows. Weekly claims are better than monthly. Include clear descriptions of completed work and follow up within 48 hours if payment doesn’t arrive on time. Delays compound quickly.
Retention Payments
Retention (or retainage) is a percentage of each progress payment held back until defects liability periods expire. Typically 5–10% of the contract value, retention can tie up significant cash for 6–12 months after project completion.
Track retention separately from standard receivables. Set calendar reminders 30 days before retention falls due, then follow up promptly. Retention often gets forgotten — it’s real money you’ve already earned.
Work-in-Progress (WIP)
WIP represents the dollar value of work you’ve completed but haven’t yet invoiced. It appears as an asset on your balance sheet. High WIP means you’re effectively financing the project for your client — you’ve incurred costs and done the work, but you haven’t billed for it.
Review WIP monthly. If it’s growing, you may be under-billing or falling behind on invoicing. If a project shows high WIP but you’ve already billed everything, there might be a coding error. Either way, WIP is a warning signal worth investigating.
For a deeper dive on cash flow timing issues, see our guide to common cash flow mistakes.
Financial Metrics Every Tradie Should Track
Beyond the ATO benchmarks, there are three metrics every trade business should track monthly. These give you an early warning system for problems before they show up in your bank account. For ongoing strategic guidance, consider our virtual CFO services.

Gross Margin by Job
Gross margin is revenue minus direct costs (materials and labour), expressed as a percentage. Calculate this for every completed job. If your target is 40% and a job came in at 28%, dig into why.
Tracking job-by-job gross margin reveals which job types are worth pursuing and which need repricing. Over time, patterns emerge — renovation jobs might consistently underperform, while new builds hit target. That’s actionable information for your quoting.
You can calculate your gross margin instantly using our free gross profit calculator.
For more on understanding your margins, see what your Profit & Loss statement is really telling you.
WIP Ratio
WIP ratio is work-in-progress divided by average monthly revenue. If your WIP is $80,000 and your average monthly revenue is $100,000, your WIP ratio is 0.8 months — meaning you’ve got nearly a month of unbilled work sitting there.
A healthy WIP ratio depends on your project cycles, but generally lower is better. Rising WIP ratio month-on-month suggests you’re getting further behind on billing, which will eventually create cash flow pressure.
Debtor Days
Debtor days measures how long it takes clients to pay you. Divide your accounts receivable by your average daily revenue. If you have $50,000 in receivables and average $2,000 per day in revenue, your debtor days are 25.
For trade businesses, debtor days under 30 is good, 30–45 is acceptable, and above 45 is a problem. Track this monthly and investigate when it spikes. One slow-paying client can blow out the average, but that’s worth knowing.
Working with a Bookkeeper Who Understands Trades
Not every bookkeeper understands the nuances of trade businesses. Many are set up for retail or service businesses where transactions are simpler and cash flow timing is more predictable.
A bookkeeper who understands trades will set up proper job costing from day one. They’ll track progress claims, retention, and WIP without you having to explain why it matters. They’ll produce job-by-job profitability reports, not just a standard P&L.
They should also understand the compliance side — security of payment requirements, insurance certificates, and the documentation you need for commercial projects.
At Hopkan Partners, we work with trade businesses across Australia. We set up job costing in Xero, track your ATO benchmarks, and deliver monthly reports that actually help you make decisions — not just tick boxes for compliance.
Get Clarity on Your Numbers
Running a trade business is demanding enough without spending your evenings wrestling with spreadsheets and wondering which jobs actually made money.
At Hopkan Partners, we provide bookkeeping and financial analysis specifically for Australian trade businesses. We’ll set up proper job costing, track your margins against ATO benchmarks, and deliver monthly reports that help you make better decisions.
Book a free consultation to discuss how we can help your trade business. No obligation, no jargon — just a conversation about your numbers.
About the Author
Ben Feng is the founder of Hopkan Partners, a Sydney-based bookkeeping and business advisory firm. A CPA-qualified accountant and Xero Certified Advisor, Ben spent over a decade in corporate finance roles at ASX-listed companies and multinationals before founding Hopkan Partners to help small businesses understand their numbers and make better decisions.
Disclaimer: This article provides general information only and does not constitute financial, legal, or tax advice. The information is current as at March 2026. For advice specific to your circumstances, please consult a qualified professional.